An economy is a series of transaction where goods and services changes hands in exchange for money or credit. Greater the transaction in the economy, higher will be the economic output and economic growth. Since cash in any economic system is presumably limited, to achieve higher transactions short-term, mid-term and long-term credit is used in exchange for goods and services. Many factors contribute to enable any person to be willing to borrow to make any purchase.
Since credit can be viewed as borrowing from the future to meet current needs, many factors like future earnings, cost of borrowing, current financial status, confidence in the economy etc. plays a critical role. All these factors are a function of central bank’s monetary and fiscal policies so monitoring their levels and changes in it could assist anyone in making a sound financial decision. The article intends to watch few factors of high importance and monitor periodic changes in them relative to their past levels.
US Gross Domestic Product (GDP)
Gross domestic product (GDP), the featured measure of U.S. output, is the market value of the goods and services produced by labor and property located in the United States.
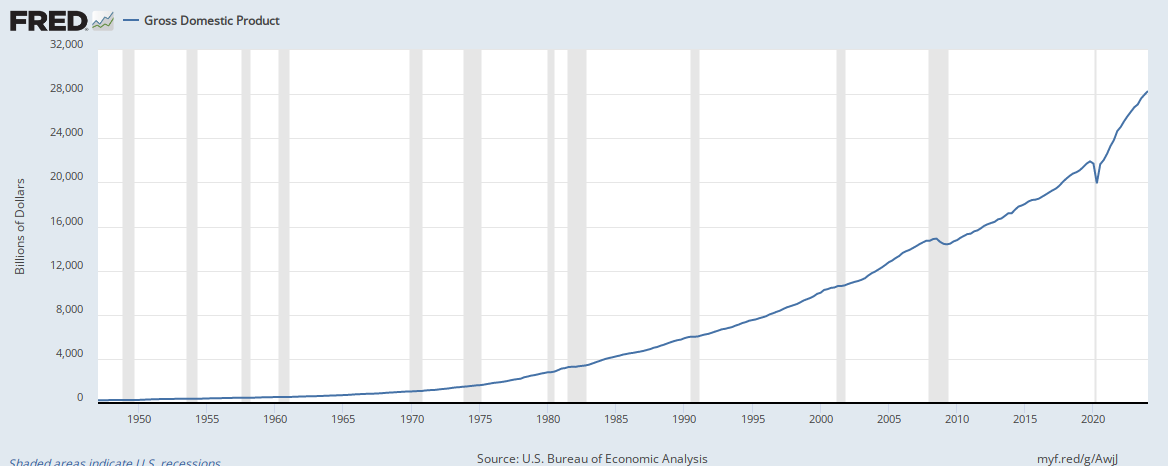
US GDP grew by 1.46% in the last quarter as reported on October of 2020. The change was 0.96% in the same quarter last year. The average change in QoQ GDP since the bottom of the financial crisis in 2009 is 0.83%. For the next fiscal year (Q4 to Q4) US GDP is expected to grow by 4.35%. The last year the expectation was -2.35%.
Annual Inflation
Inflation as measured by the consumer price index reflects the annual percentage change in the cost to the average consumer of acquiring a basket of goods and services that may be fixed or changed at specified intervals, such as yearly.
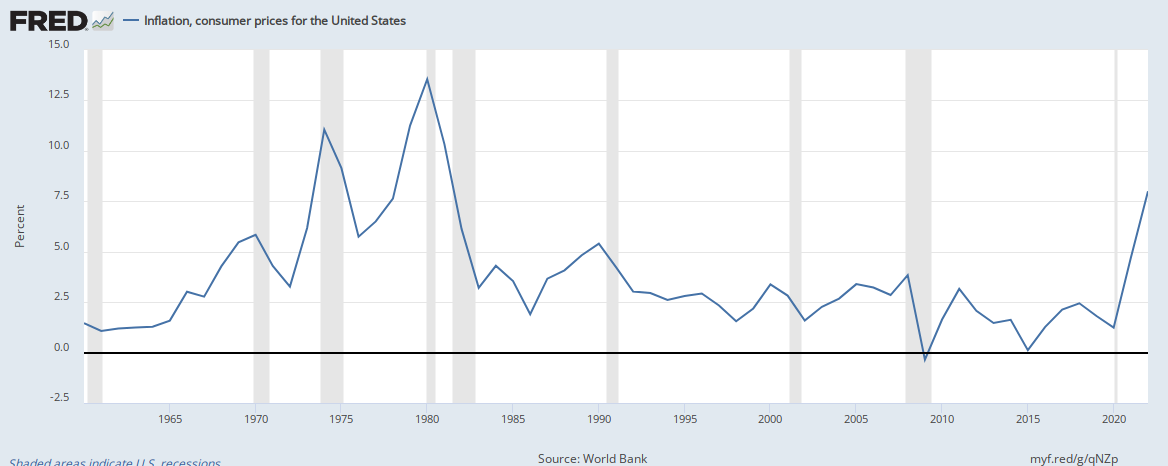
As of the end of 2019 inflation was 1.81% a 25.81% decrease over the last year. The average inflation rate since the bottom of 2008 Financial Crisis is 1.58%
Inflation Expectation
University of Michigan (UoM) Inflation Expectations measures the percentage that consumers expect the price of goods and services to change during the next 12 months.

As of December 2020 the inflation is expected to be 2.5% in the next 12 months a 8.7% increase over the same period last year. The average expectation since the bottom of the Financial Crisis is 2.86%. Post financial crisis in 2008 the 12 month forward expectation peaked at 4.6% in March of 2011 and made a low of 1.9% in February of 2009.
M1 Money Supply
M1 includes funds that are readily accessible for spending. M1 consists of: (1) currency outside the U.S. Treasury, Federal Reserve Banks, and the vaults of depository institutions; (2) traveler's checks of nonbank issuers; (3) demand deposits; and (4) other checkable deposits (OCDs), which consist primarily of negotiable order of withdrawal (NOW) accounts at depository institutions and credit union share draft accounts.
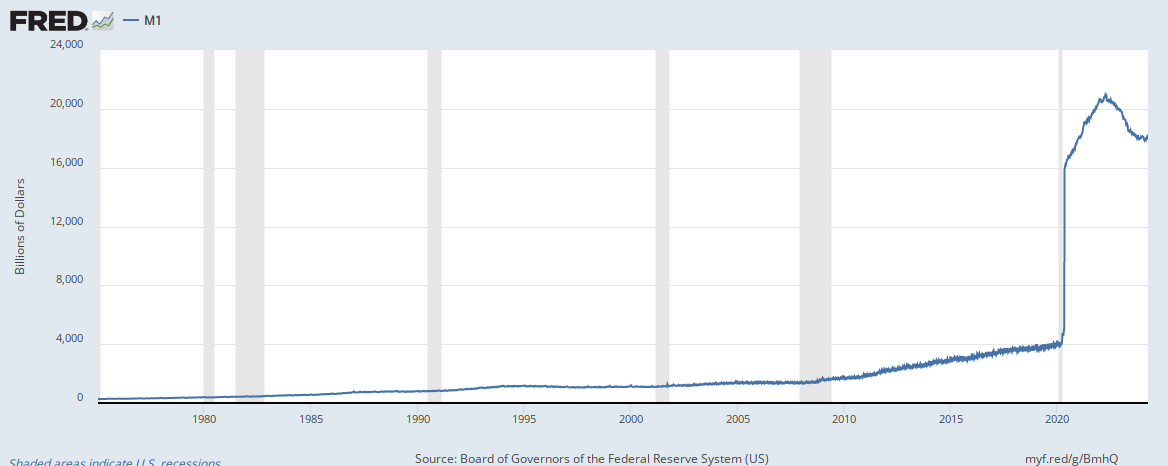
As of January 2021 the M1 money supply was $18019.9B a 2.94% increase over the same period last year. The average supply since the bottom of the Financial Crisis is $3693.13B. Post financial crisis the supply rate peaked at $18149.4B in January of 2021 and made a low of $1522.6B in February of 2009.
M2 Supply
M2 includes a broader set of financial assets held principally by households. M2 consists of M1 plus: (1) savings deposits (which include money market deposit accounts, or MMDAs); (2) small-denomination time deposits (time deposits in amounts of less than $100,000); and (3) balances in retail money market mutual funds (MMMFs).
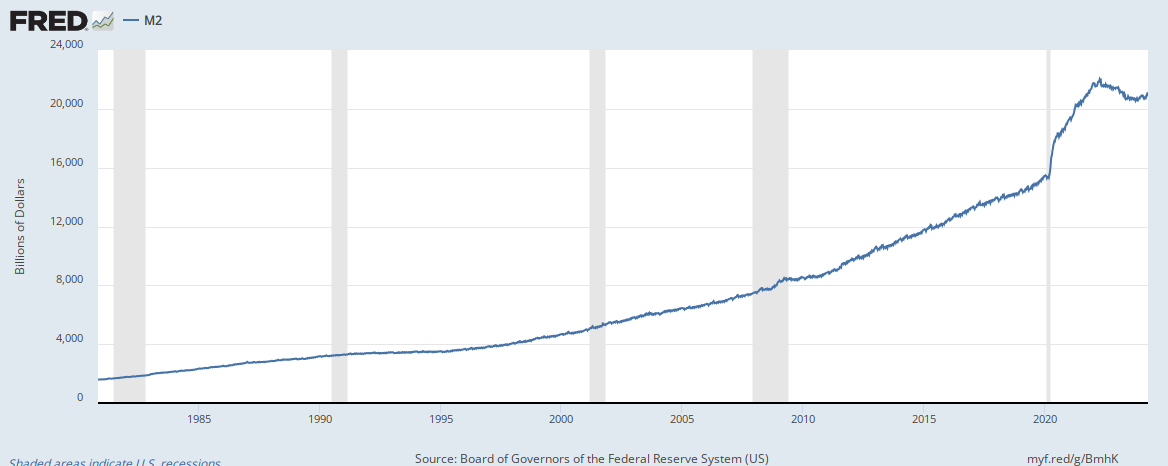
As of January 2021 the M2 supply was $19321.9B a 2.39% increase over the same period last year. The average supply since the bottom of the Financial Crisis is $12012.23B. Post financial crisis in 2008 the M2 supply peaked at $19467.1B in January of 2021 and made a low of $8235.1B in January of 2009.
Bank Prime Loan Rate
Rate posted by a majority of top 25 (by assets in domestic offices) insured U.S.-chartered commercial banks. Prime is one of several base rates used by banks to price short-term business loans.
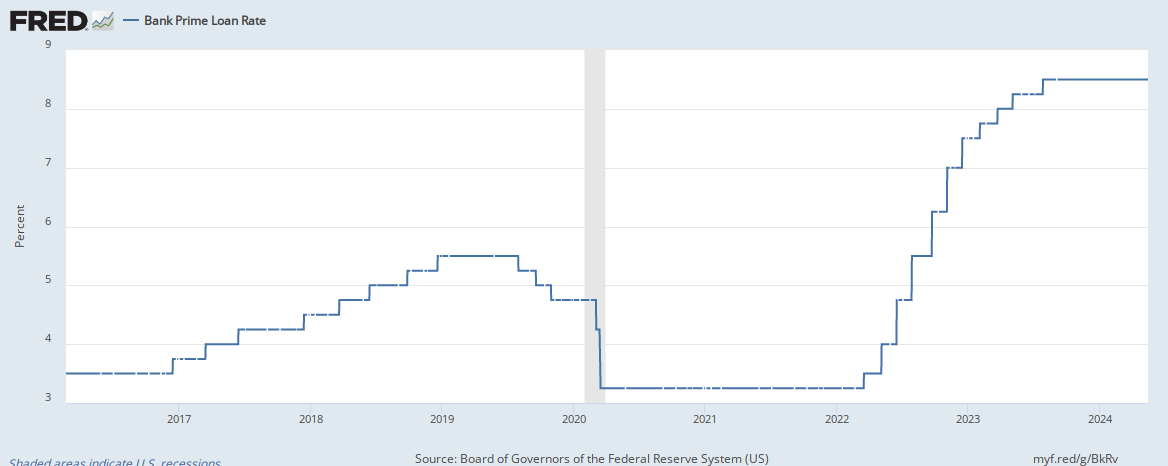
As of January 2021 the prime rate was 3.25% a 0.0% increase over the same period last year. The average rate since the bottom of the Financial Crisis is 3.67%. Post financial crisis in 2008 the rate peaked at 5.5% in December of 2018 and made a low of 3.25% in January of 2009.
Effective Fund Rate
The federal funds rate is the interest rate at which depository institutions trade federal funds (balances held at Federal Reserve Banks) with each other overnight. In simpler terms, a bank with excess cash, which is often referred to as liquidity, will lend to another bank that needs to quickly raise liquidity.
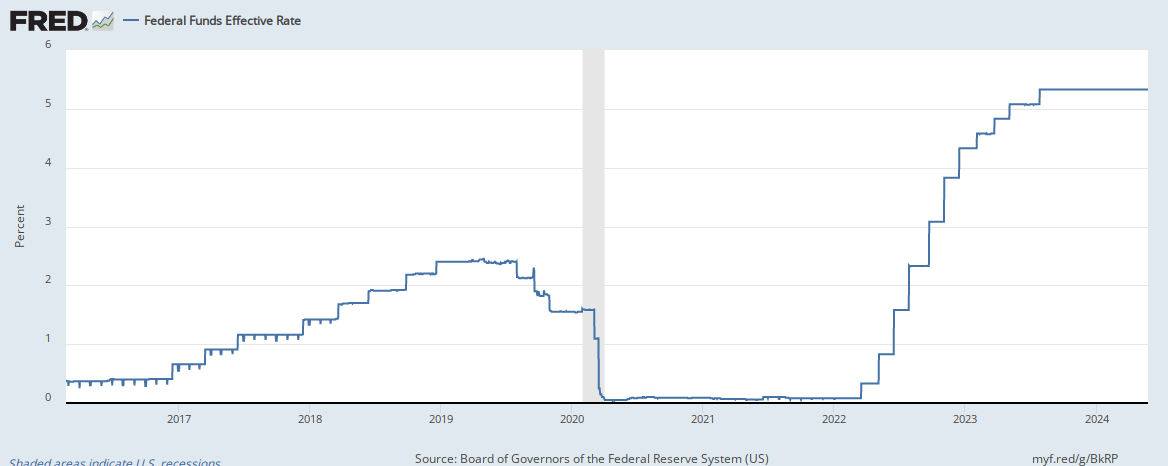
As of January 2021 the effective fund rate was 0.07% a 22.22% decrease over the same period last year. The average rate since the bottom of the Financial Crisis is 0.55%. Post financial crisis in 2008 the overnight lending rate peaked at 2.45% in April of 2019 and made a low of 0.04% in December of 2011.
Unemployment Rate
The unemployment rate represents the number of unemployed as a percentage of the labor force. Labor force data are restricted to people 16 years of age and older, who currently reside in 1 of the 50 states or the District of Columbia, who do not reside in institutions (e.g., penal and mental facilities, homes for the aged), and who are not on active duty in the Armed Forces.
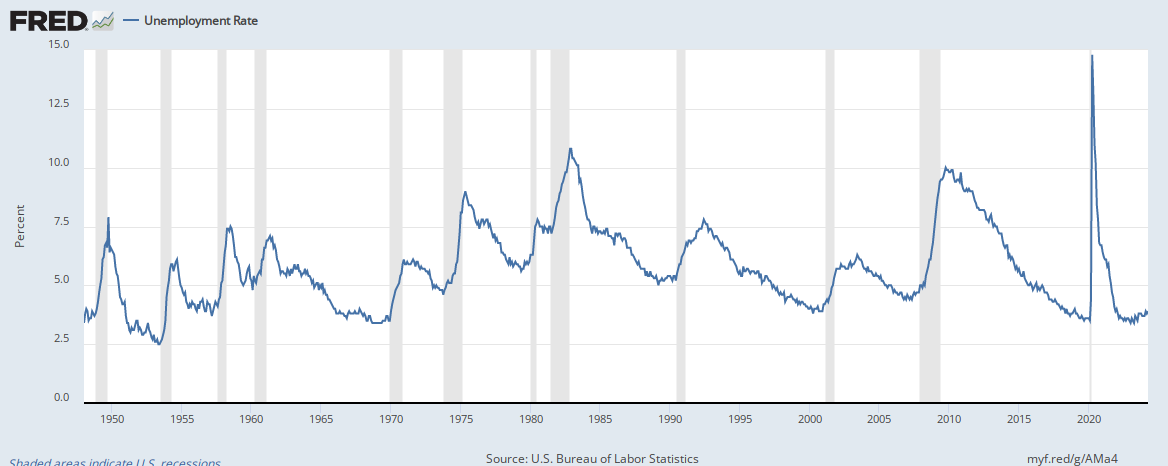
As of January 2021 the unemployment rate was 6.3% a 80.0% increase over the same period last year. The average unemployment rate since the bottom of the Financial Crisis is 6.63%. Post financial crisis the unemployment rate peaked at 14.8% in April of 2020 andmade a low of 3.5% in September of 2019.
Consumer Sentiment Index
The Michigan Consumer Sentiment Index (MCSI) is a monthly survey of consumer confidence levels in the United States conducted by the University of Michigan. The survey is based on telephone interviews that gather information on consumer expectations for the economy.
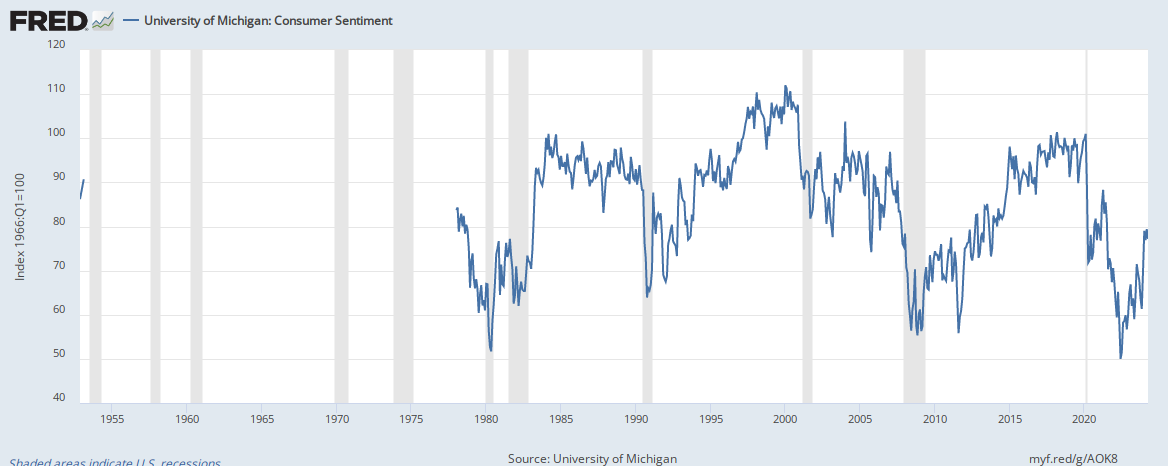
As of December 2020 the UMich Consumer Sentiment Index was 80.7 a 18.73% decrease over the same period last year. The average index value since the bottom of the Financial Crisis is 83.56. Post financial crisis in 2008 the index peaked at 101.4 in March of 2018 and made a low of 55.8 in August of 2011.
Personal Consumption Expenditures
Personal consumption expenditures are a measure of consumer spending for a period of time. The PCE Price Index is the primary inflation index used by the U.S. Federal Reserve when making monetary policy decisions.
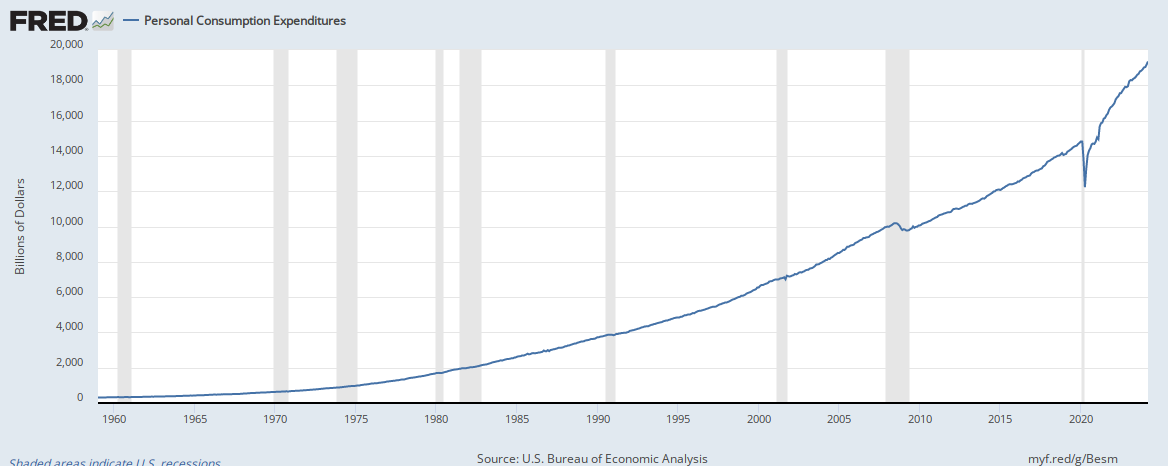
As of December 2020 the PCE index was $14493.7 billions a 2.05% decrease over the same period last year. The average index value since the bottom of the Financial Crisis is $12159.09 billions. Post financial crisis in 2008 the index peaked at $14880.5 billions in January of 2020 and made a low of $9718.5 billions in March of 2009.
Industrial Production Index
The Industrial Production Index (INDPRO) is an economic indicator that measures real output for all facilities located in the United States manufacturing, mining, and electric, and gas utilities (excluding those in U.S. territories).
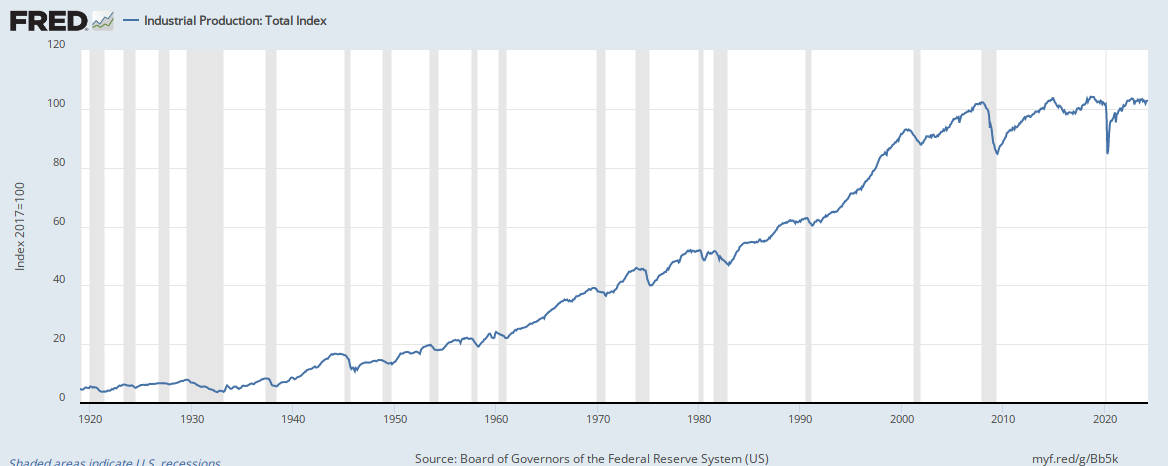
As of January 2021 the index was 107.18 a 1.83% decrease over the same period last year. The average index value since the bottom of the Financial Crisis is 101.58. Post financial crisis in 2008 the index peaked at 110.55 in December of 2018 and made a low of 87.07 in June of 2009.
Capacity Utilization: Total Industry
Capacity Utilization is the percentage of resources used by corporations and factories to produce goods in manufacturing, mining, and electric and gas utilities for all facilities located in the United States (excluding those in U.S. territories).
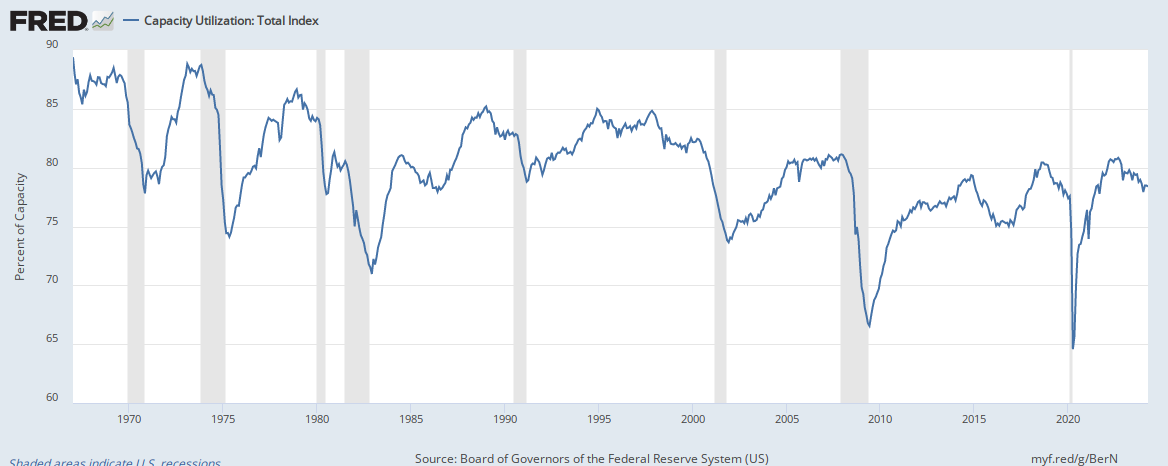
As of January 2021 the utilization index was 75.55 a 1.72% decrease over the same period last year. The average index value since the bottom of the Financial Crisis is 75.65. Post financial crisis in 2008 the index peaked at 79.57 in November of 2018 and made a low of 64.24 in April of 2020.
Disclosures:
This website (the “Blog”) is created, published and provided for informational and entertainment purposes only. The information in the Blog constitutes the Content Creator’s own opinions and any guest bloggers posting from time to time.
The opinions expressed in the Blog are for general informational purposes only and are not intended to provide specific advice or recommendations for any individual or on any specific security or investment product. It is only intended to provide education about the financial industry. The views reflected in the commentary are subject to change at any time without notice.
Nothing on this Blog constitutes investment advice, performance data or any recommendation that any security, portfolio of securities, investment product, transaction or investment strategy is suitable for any specific person. From reading my Blog I cannot assess anything about your personal circumstances, your finances, or your goals and objectives, all of which are unique to you, so any opinions or information contained on this Blog are just that – an opinion or information. You should not use my Blog to make financial decisions and I highly recommended you seek professional advice from someone who is authorized to provide investment advice.
references: https://fred.stlouisfed.org/, www.yahoofinance.com, www.investopedia.com

Bovada continues to be updating its website with new betting opportunities; it launched horse betting relatively recently and its reside sellers have gotten increasingly more in style. Although this website is a bit ‘clunky’ in terms of|when it comes to|by means of} accessibility, it’s undoubtedly a legit and safe crypto gambling platform. In our opinion, BitStarz is one of the|is amongst the|is likely one of the} finest Bitcoin gambling sites outcome of|as a outcome of} it’s obtained all the bases lined; from online security to a fantastic variety of games, bonuses, and transparency, BitStarz is all you have got|that you have} been on the lookout for and more. Some individuals say that 메리트카지노 buying and selling in a stock market is a type of gambling. Others, however, insist that purchasing and selling shares is investing, and never betting. The stock market is the whole market where merchants buy and sell shares.
ReplyDelete